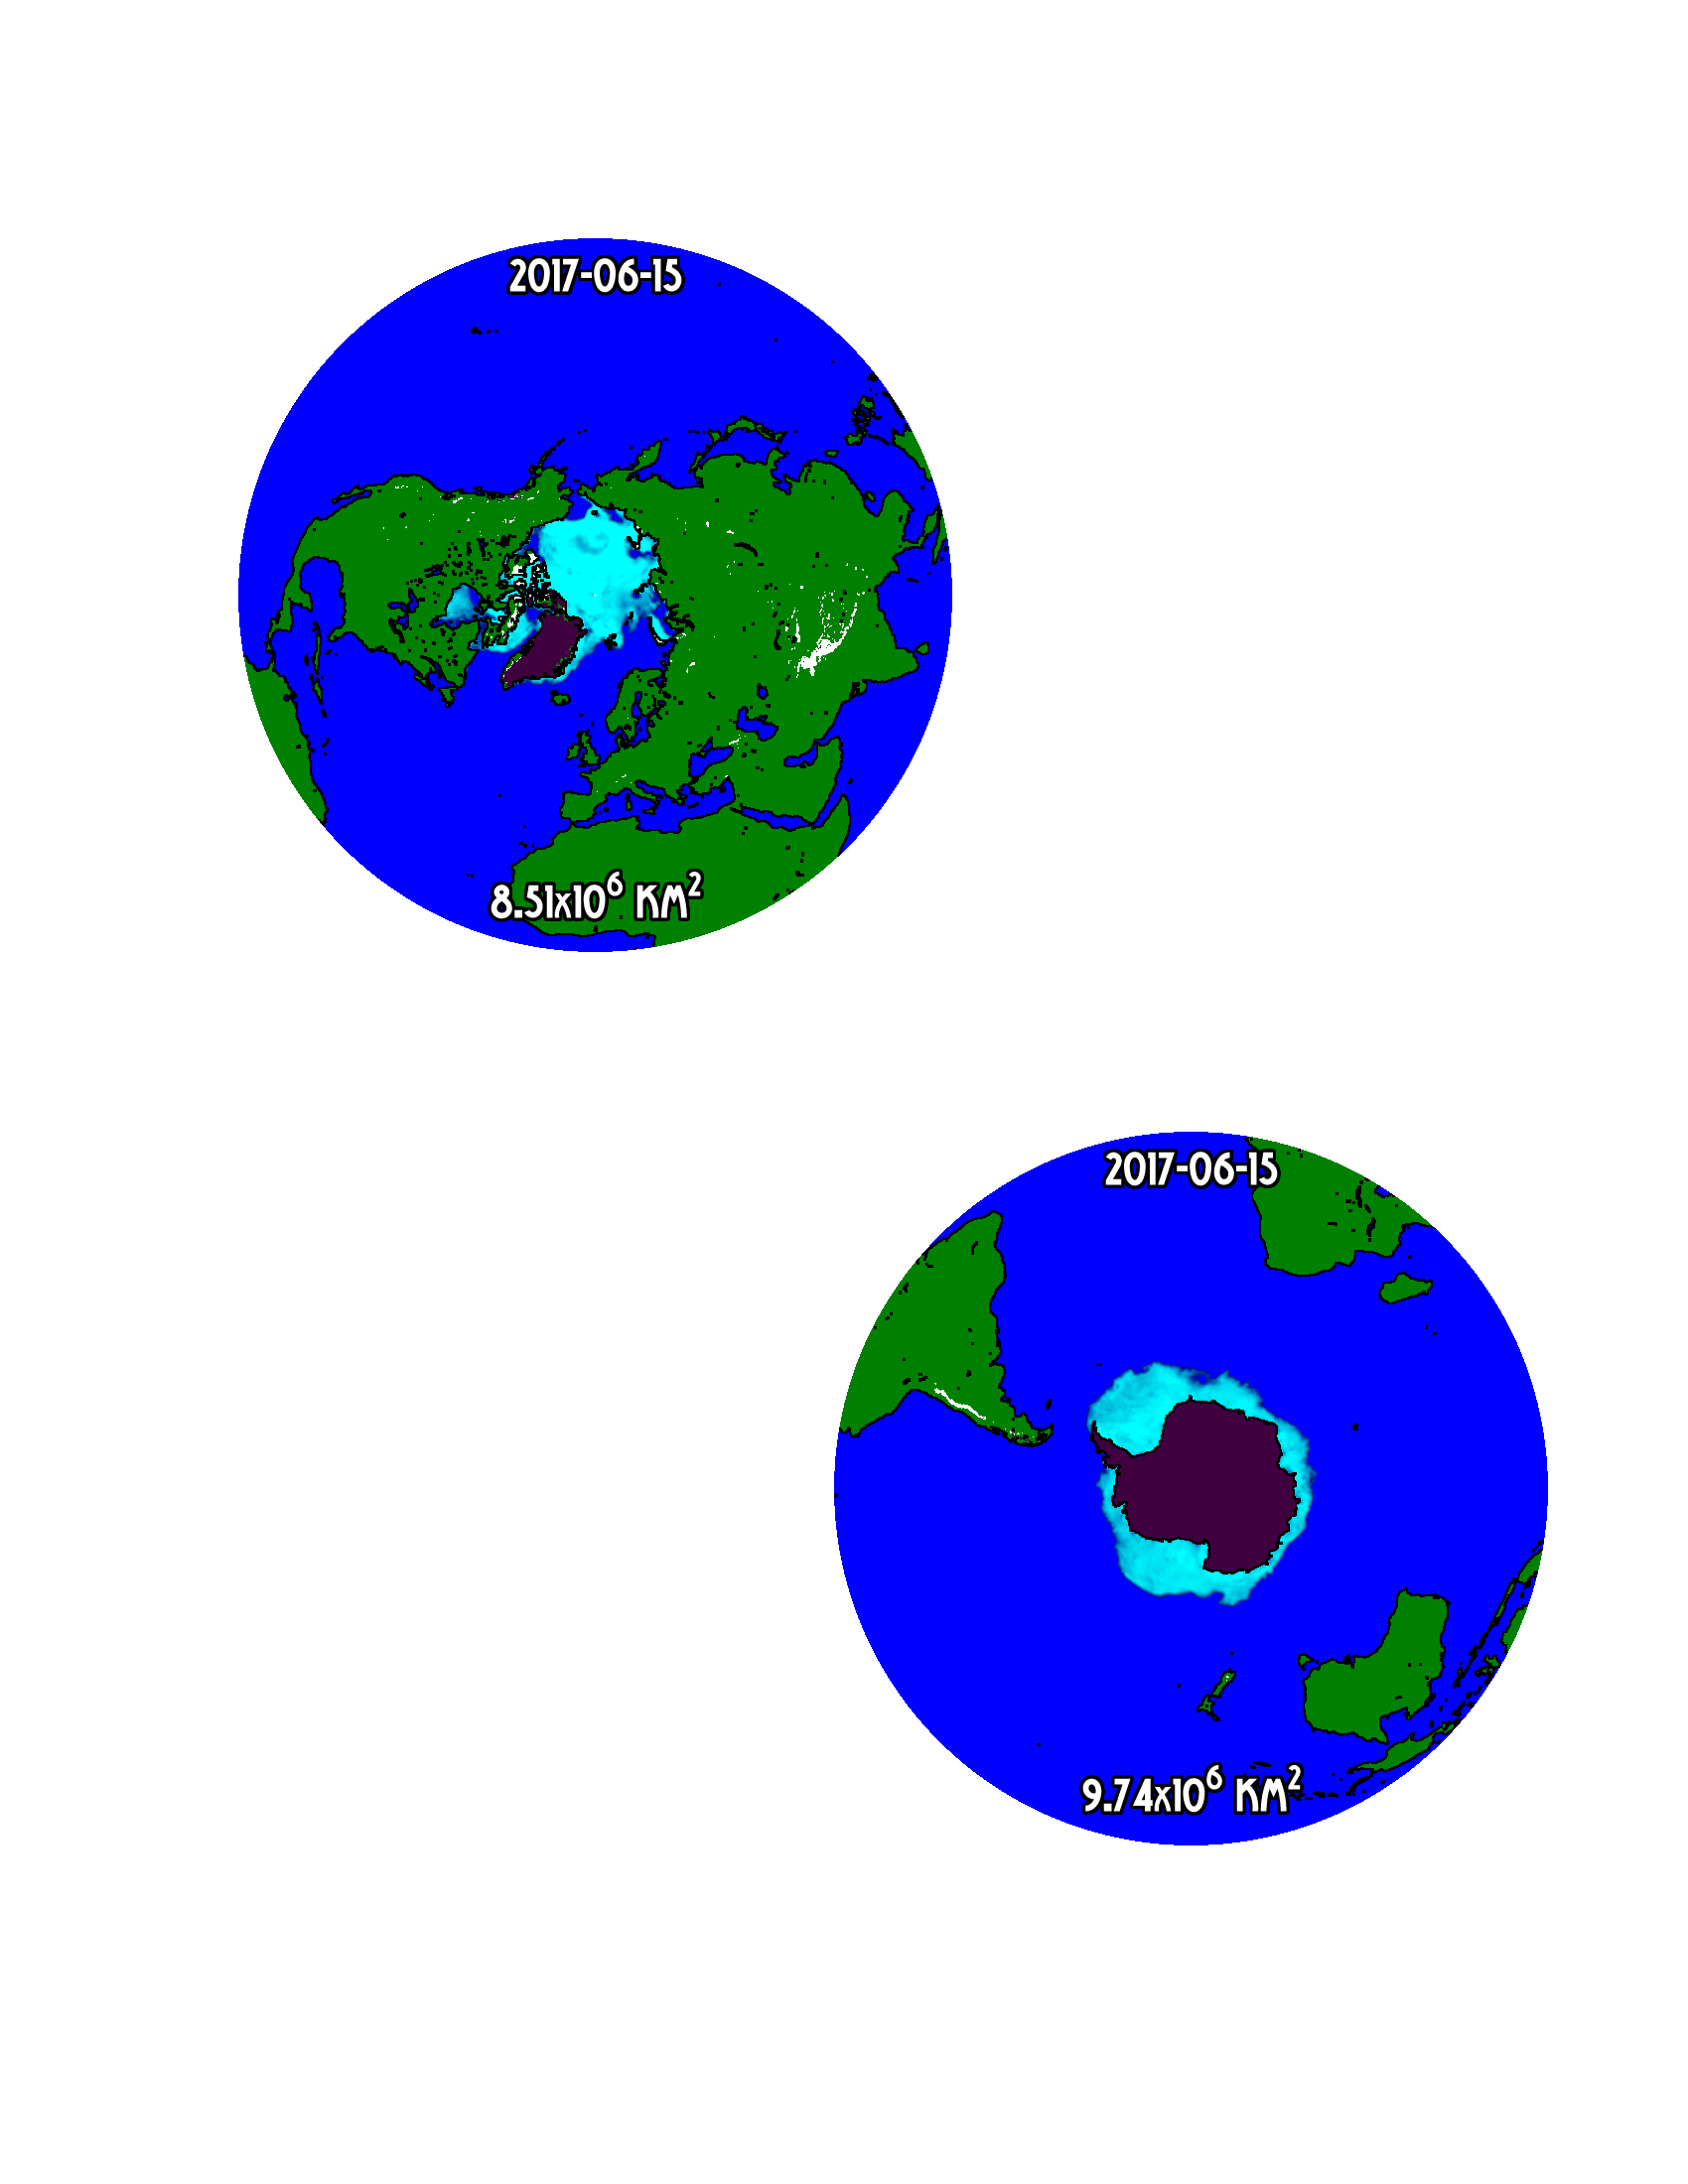
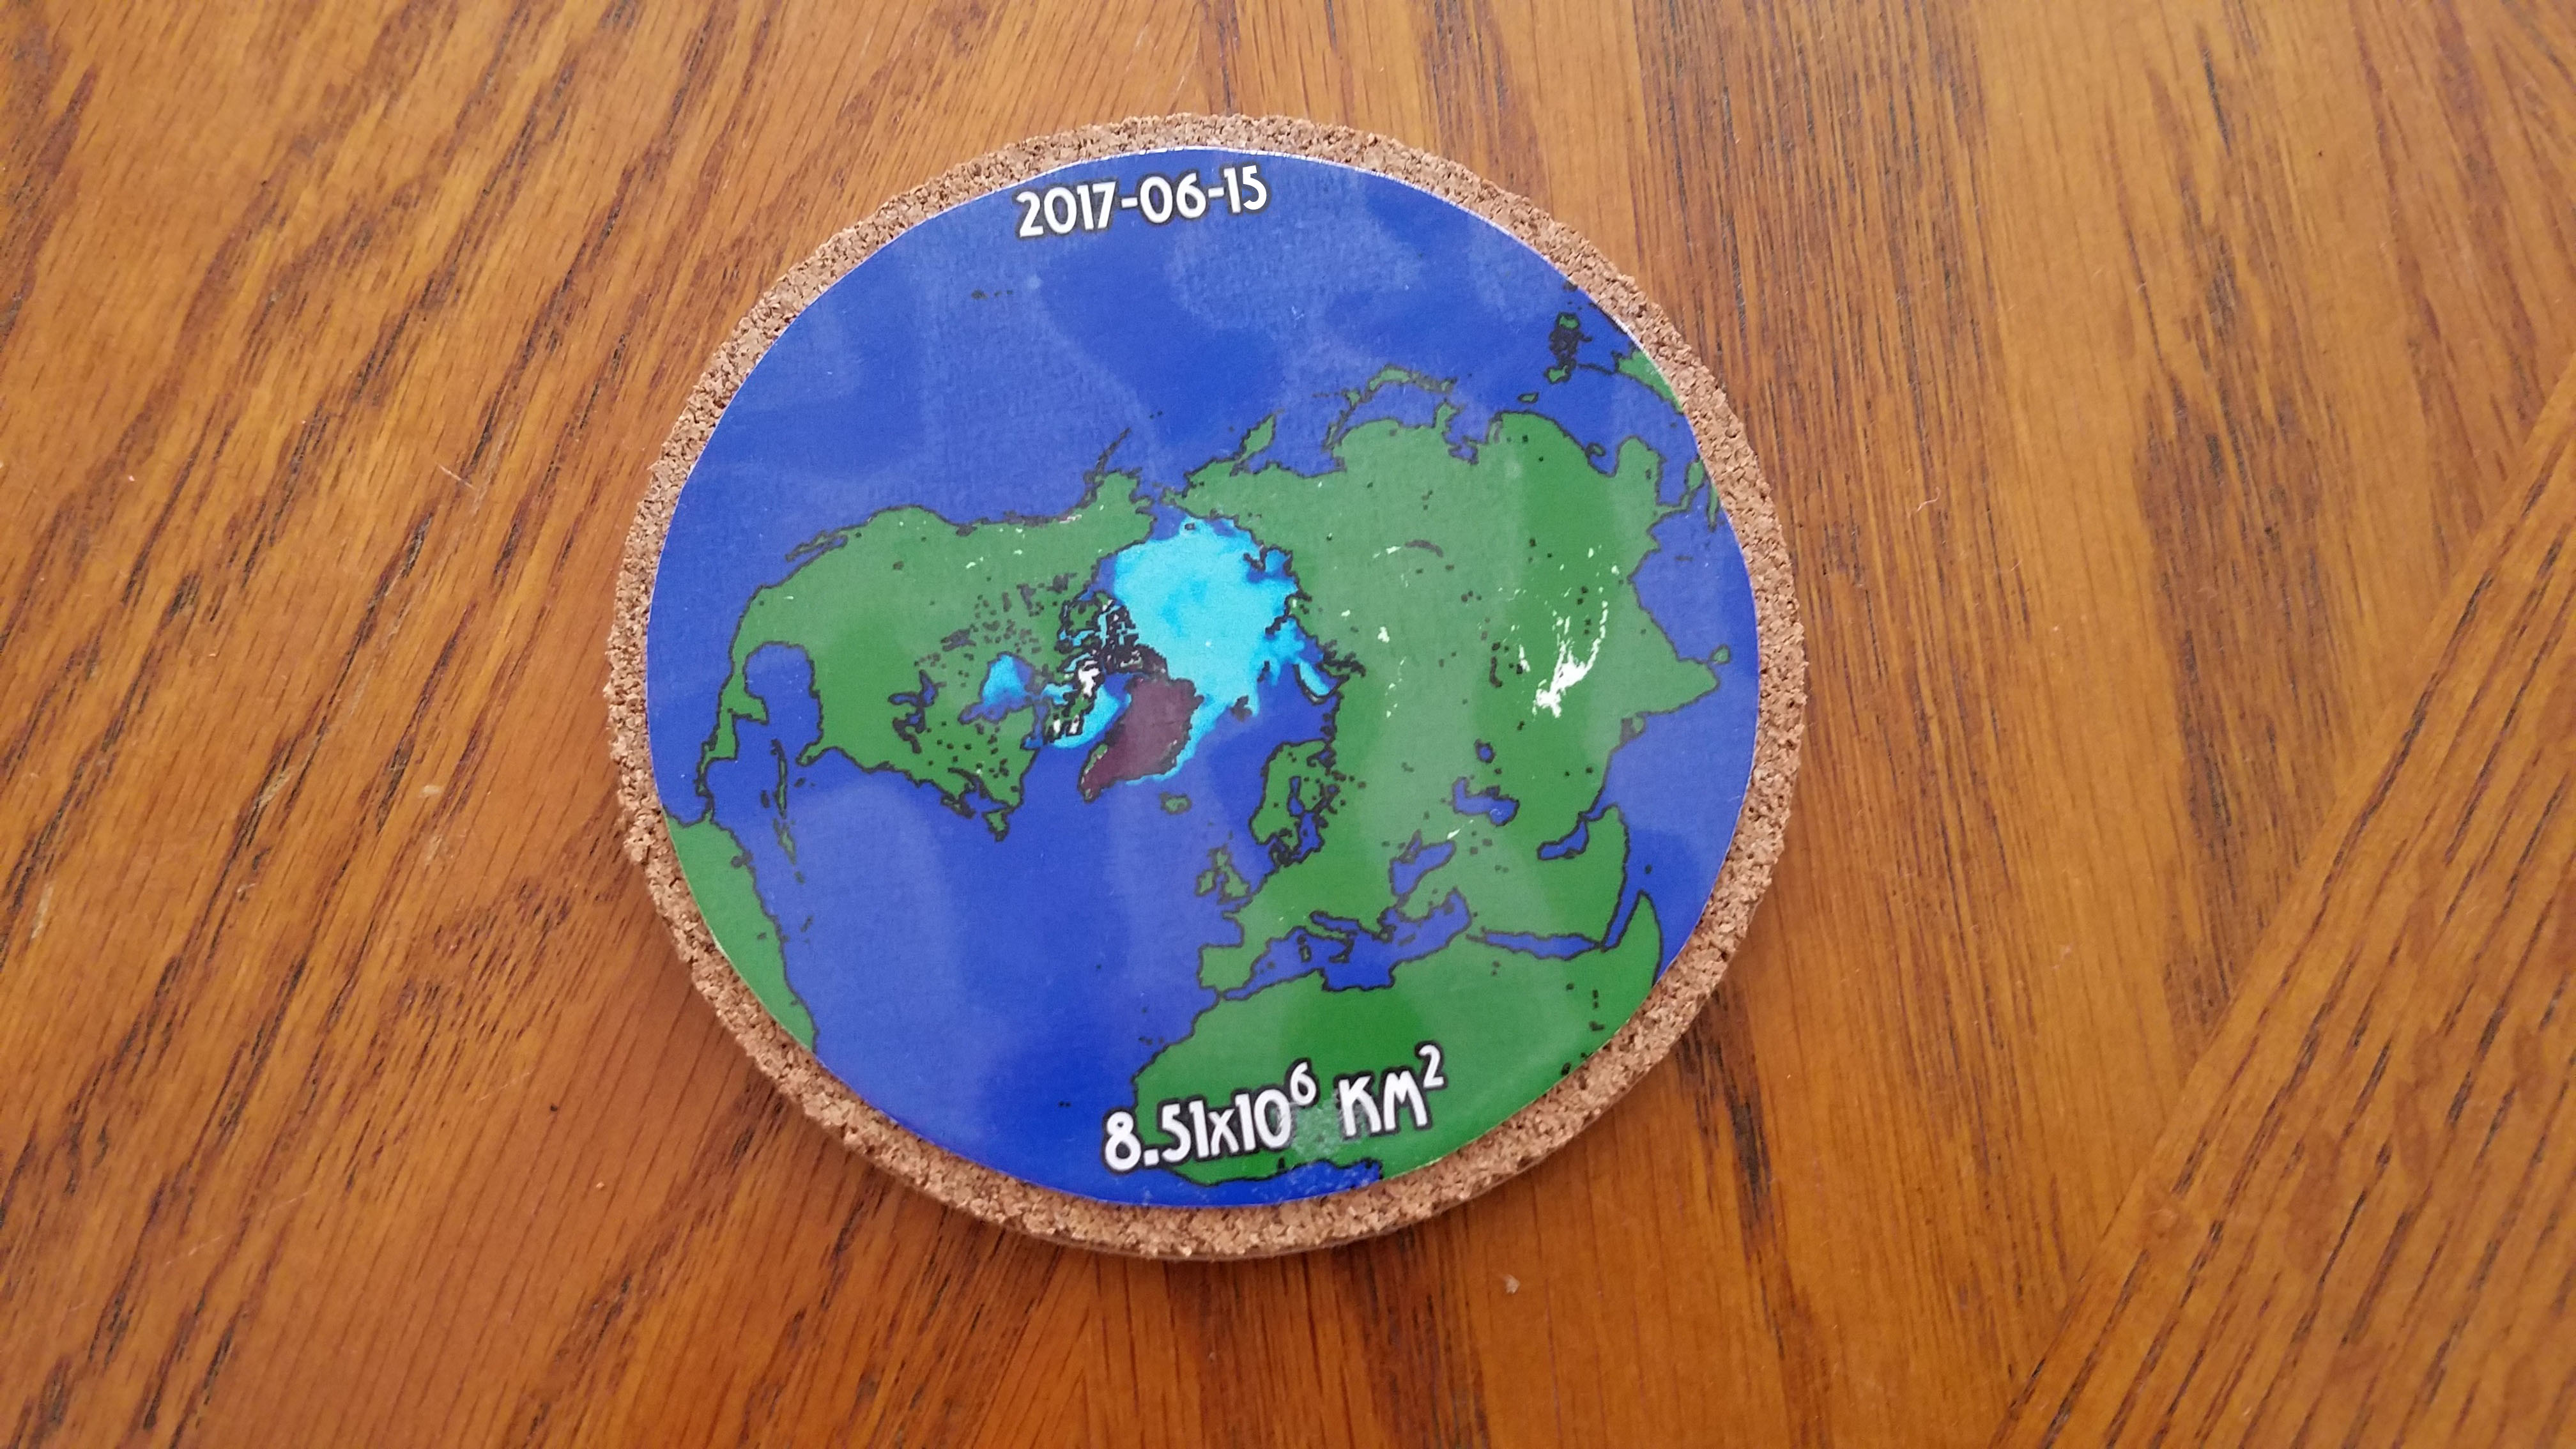
As part of my job, I see a lot of Earth science data, some of which is delivered to my email inbox daily. Even though I’m not a geoscientist by training, I often find myself thinking of things to do with our data in my free time. One such project was to make some coasters displaying the Near Real Time Ice and Snow Extent (NISE) imagery.
The details about how I prototyped and created these coasters after the jump.
First, it’s worth noting that my choice for using NISE was fairly targeted – the data are in HDF-EOS format, which makes it easy to convert between formats. It’s also round, so I wouldn’t have to do any reprojection or masking to get what I want out of it. Finally, I like NISE – I’ve been looking at it every day for almost a decade… …It kind of grows on you.
Next, I needed some raw materials. For this project I picked up some simple cork coasters at Wal-mart. Pretty much any round coasters will do; the ones I picked for prototyping were double sided (perfect for north on one side, south on the other). For my final version, I went with something a bit nicer, and they came in stacks of four:

For me, the next step was getting it out of a scientific format, and into an image format. This may seem counter-intuitive (I just said that it being in HDF-EOS was good), but the fact of the matter is that what I’m doing is not really science, so an image format is going to do what I need better. To do this, I used NSIDC’s OPeNDAP endpoint and my favorite bash/perl/imagemagick pipeline to get it into a color png:
curl 'https://n5eil01u.ecs.nsidc.org/opendap/OTHR/NISE.005/2017.06.15/NISE_SSMISF18_20170615.HDFEOS.ascii?Extent\[0:1:720\]\[0:1:720\]' | grep ^Extent | perl -ne 'chomp; @nums = split(/,\s*/, $_); shift @nums; print pack("c*", @nums);' | convert -size 721x721 -depth 8 GRAY:- nise_color.png -clut nise_north.png
curl 'https://n5eil01u.ecs.nsidc.org/opendap/OTHR/NISE.005/2017.05.15/NISE_SSMISF18_20170615.HDFEOS.ascii?Extent_1\[0:1:720\]\[0:1:720\]' | grep ^Extent | perl -ne 'chomp; @nums = split(/,\s*/, $_); shift @nums; print pack("c*", @nums);' | convert -size 721x721 -depth 8 GRAY:- nise_color.png -clut nise_south.png
(here is the color map – nise_color.png)
If you’re not a fan of pipelines, you can alternately just download the files and use gdal_translate to convert them to pngs. Then, you can use imagemagick to apply the color map, or just drop it into your image tool of choice and do the image manipulation there. In this case, the commands would be:
gdal_translate -of png 'HDF4_EOS:EOS_GRID:"NISE_SSMISF18_20170615.HDFEOS":Northern Hemisphere:Extent' raw_nise_north.png
gdal_translate -of png 'HDF4_EOS:EOS_GRID:"NISE_SSMISF18_20170615.HDFEOS":Southern Hemisphere:Extent' raw_nise_south.png
convert raw_nise_north nise_color.png -clut nise_north.png
convert raw_nise_south nise_color.png -clut nise_south.png
After that, I resized the image to the size of the coaster. I usually make mine a bit smaller than the coaster so that there’s a bit of a border. You’ll want to do this with a quick inches-to-pixels calculation, then resize. At this point you can also embellish your creation by adding a date or the area value to the image. Again, you image tool of choice will be best here. Here is what mine looked like:
(I used the sea ice area from the 2017 monthly sea ice index for the value at the bottom – not necessarily the same as the area pictured, but close enough for this purpose.)
Then, print the image and laminate it. I printed mine to white photo paper, then laminated with a thermal laminator. The photo paper is going to hold the image better, and also should reduce wicking of any moisture that gets under the laminant.
Finally, cut out the printed image with scissors adhere to the coaster. I use 3M all-purpose spray glue for this, as it’s the best spray glue I’ve found out there.
Et voila! A NISE coaster that you can talk about with your friends over (or under) a cold drink. In deciding what dates to use, here are a few ideas:
- You can use your birthday from this year or any year after the data product started.
- You can use the dates of the sea ice maximum and minimum for the most recent year or the lowest year on record for the Arctic (2012).
- The set I am planning to make has the maximum and minimum dates for each of the Arctic and Antarctic for a pretty cool set of four.


