
I posted a while back that my car provided me monthly metrics, but that they weren’t quite enough for what I really wanted out of car metrics. To try to get at what I was really interested in, I picked up an OBD-II scanner and grabbed the Torque app for my phone. With this combination, I was able to get very detailed csv exports of all kinds of cool information. With that I decided to put together my own metrics of my driving habits over the last couple of months.
Chart goodness after the jump.
First, some high level stuff:
Between October 5 at 4:03pm and November 25 at 10:40pm, I recorded 133 trips totaling 1,865 miles and 47 hours. My average trip length was 21.5 minutes while my shortest was 10 seconds (probably reparking) and my longest was 4 hours (driving back from Grand Junction on October 24). During that time, I’ve filled my gas tank 7 times for a total of 64.8 gallons of gas to get a average gas mileage of of 32.3 mpg (using my odometer, as I know I missed a couple of trips).
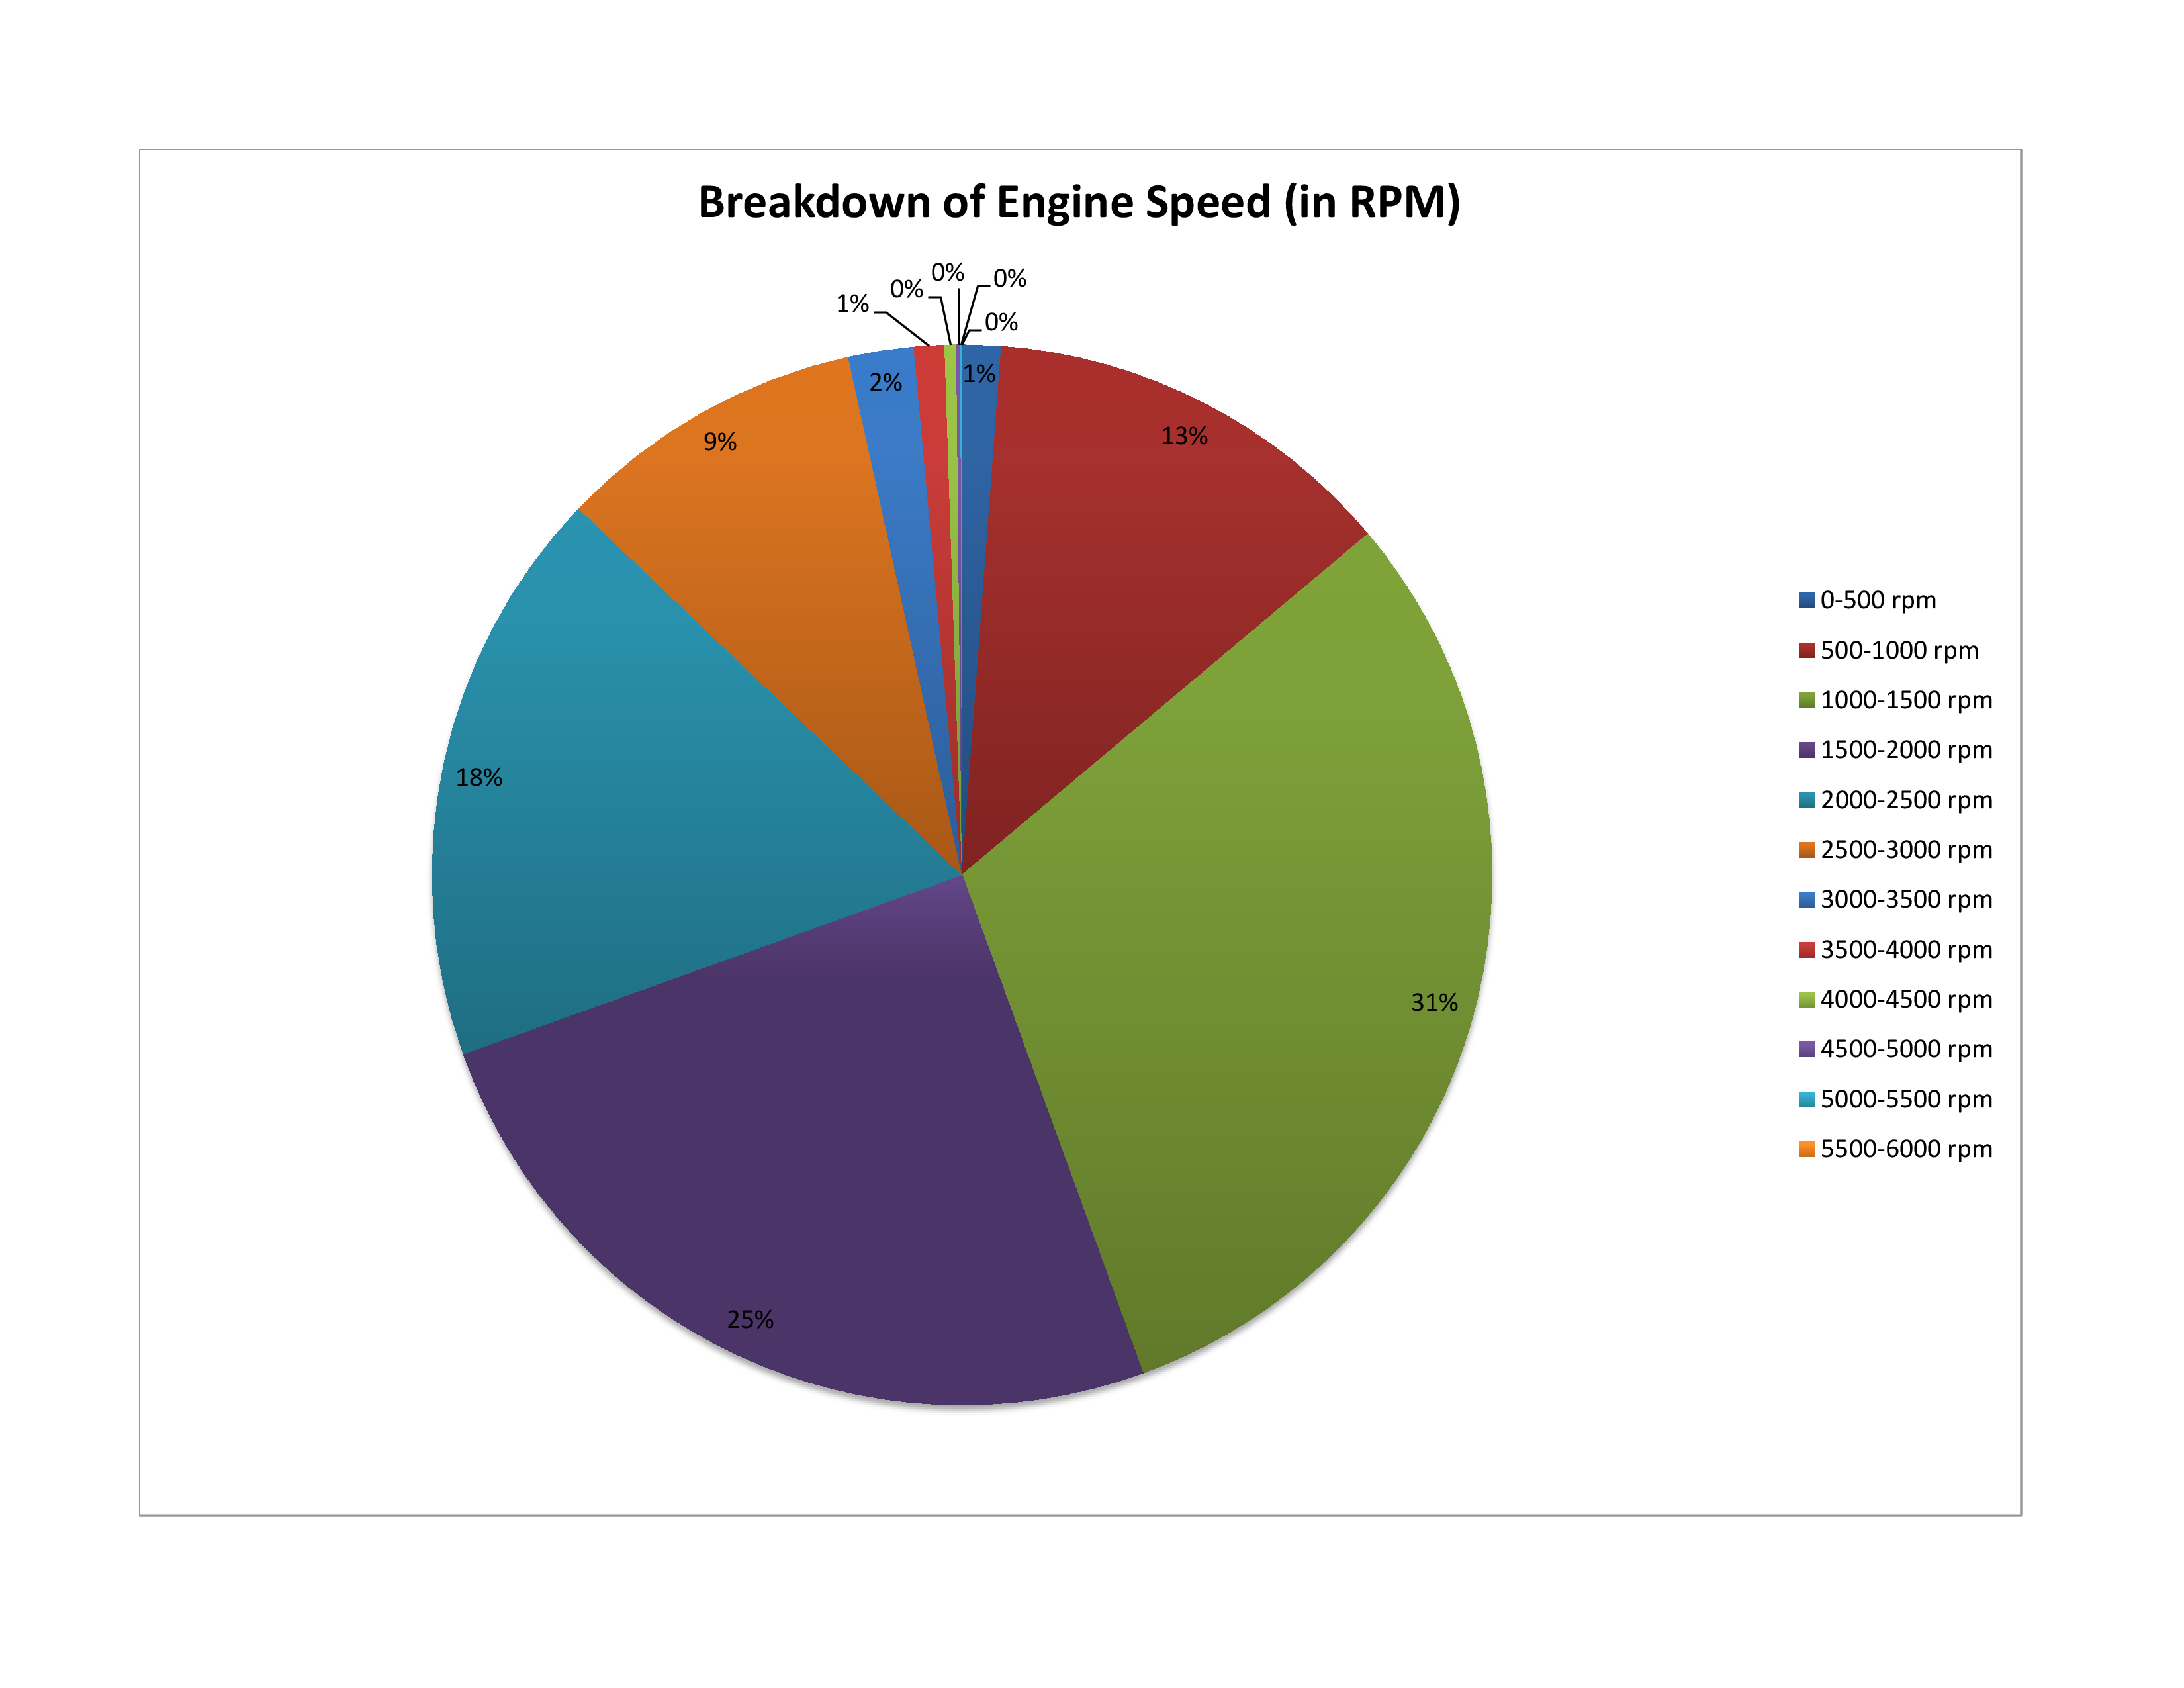
Getting into some more gritty stuff, my average engine speed during that time was 1713 RPM, ranging from 0 to 5628 RPMs. The graph of distributions of my engine speed looks like:
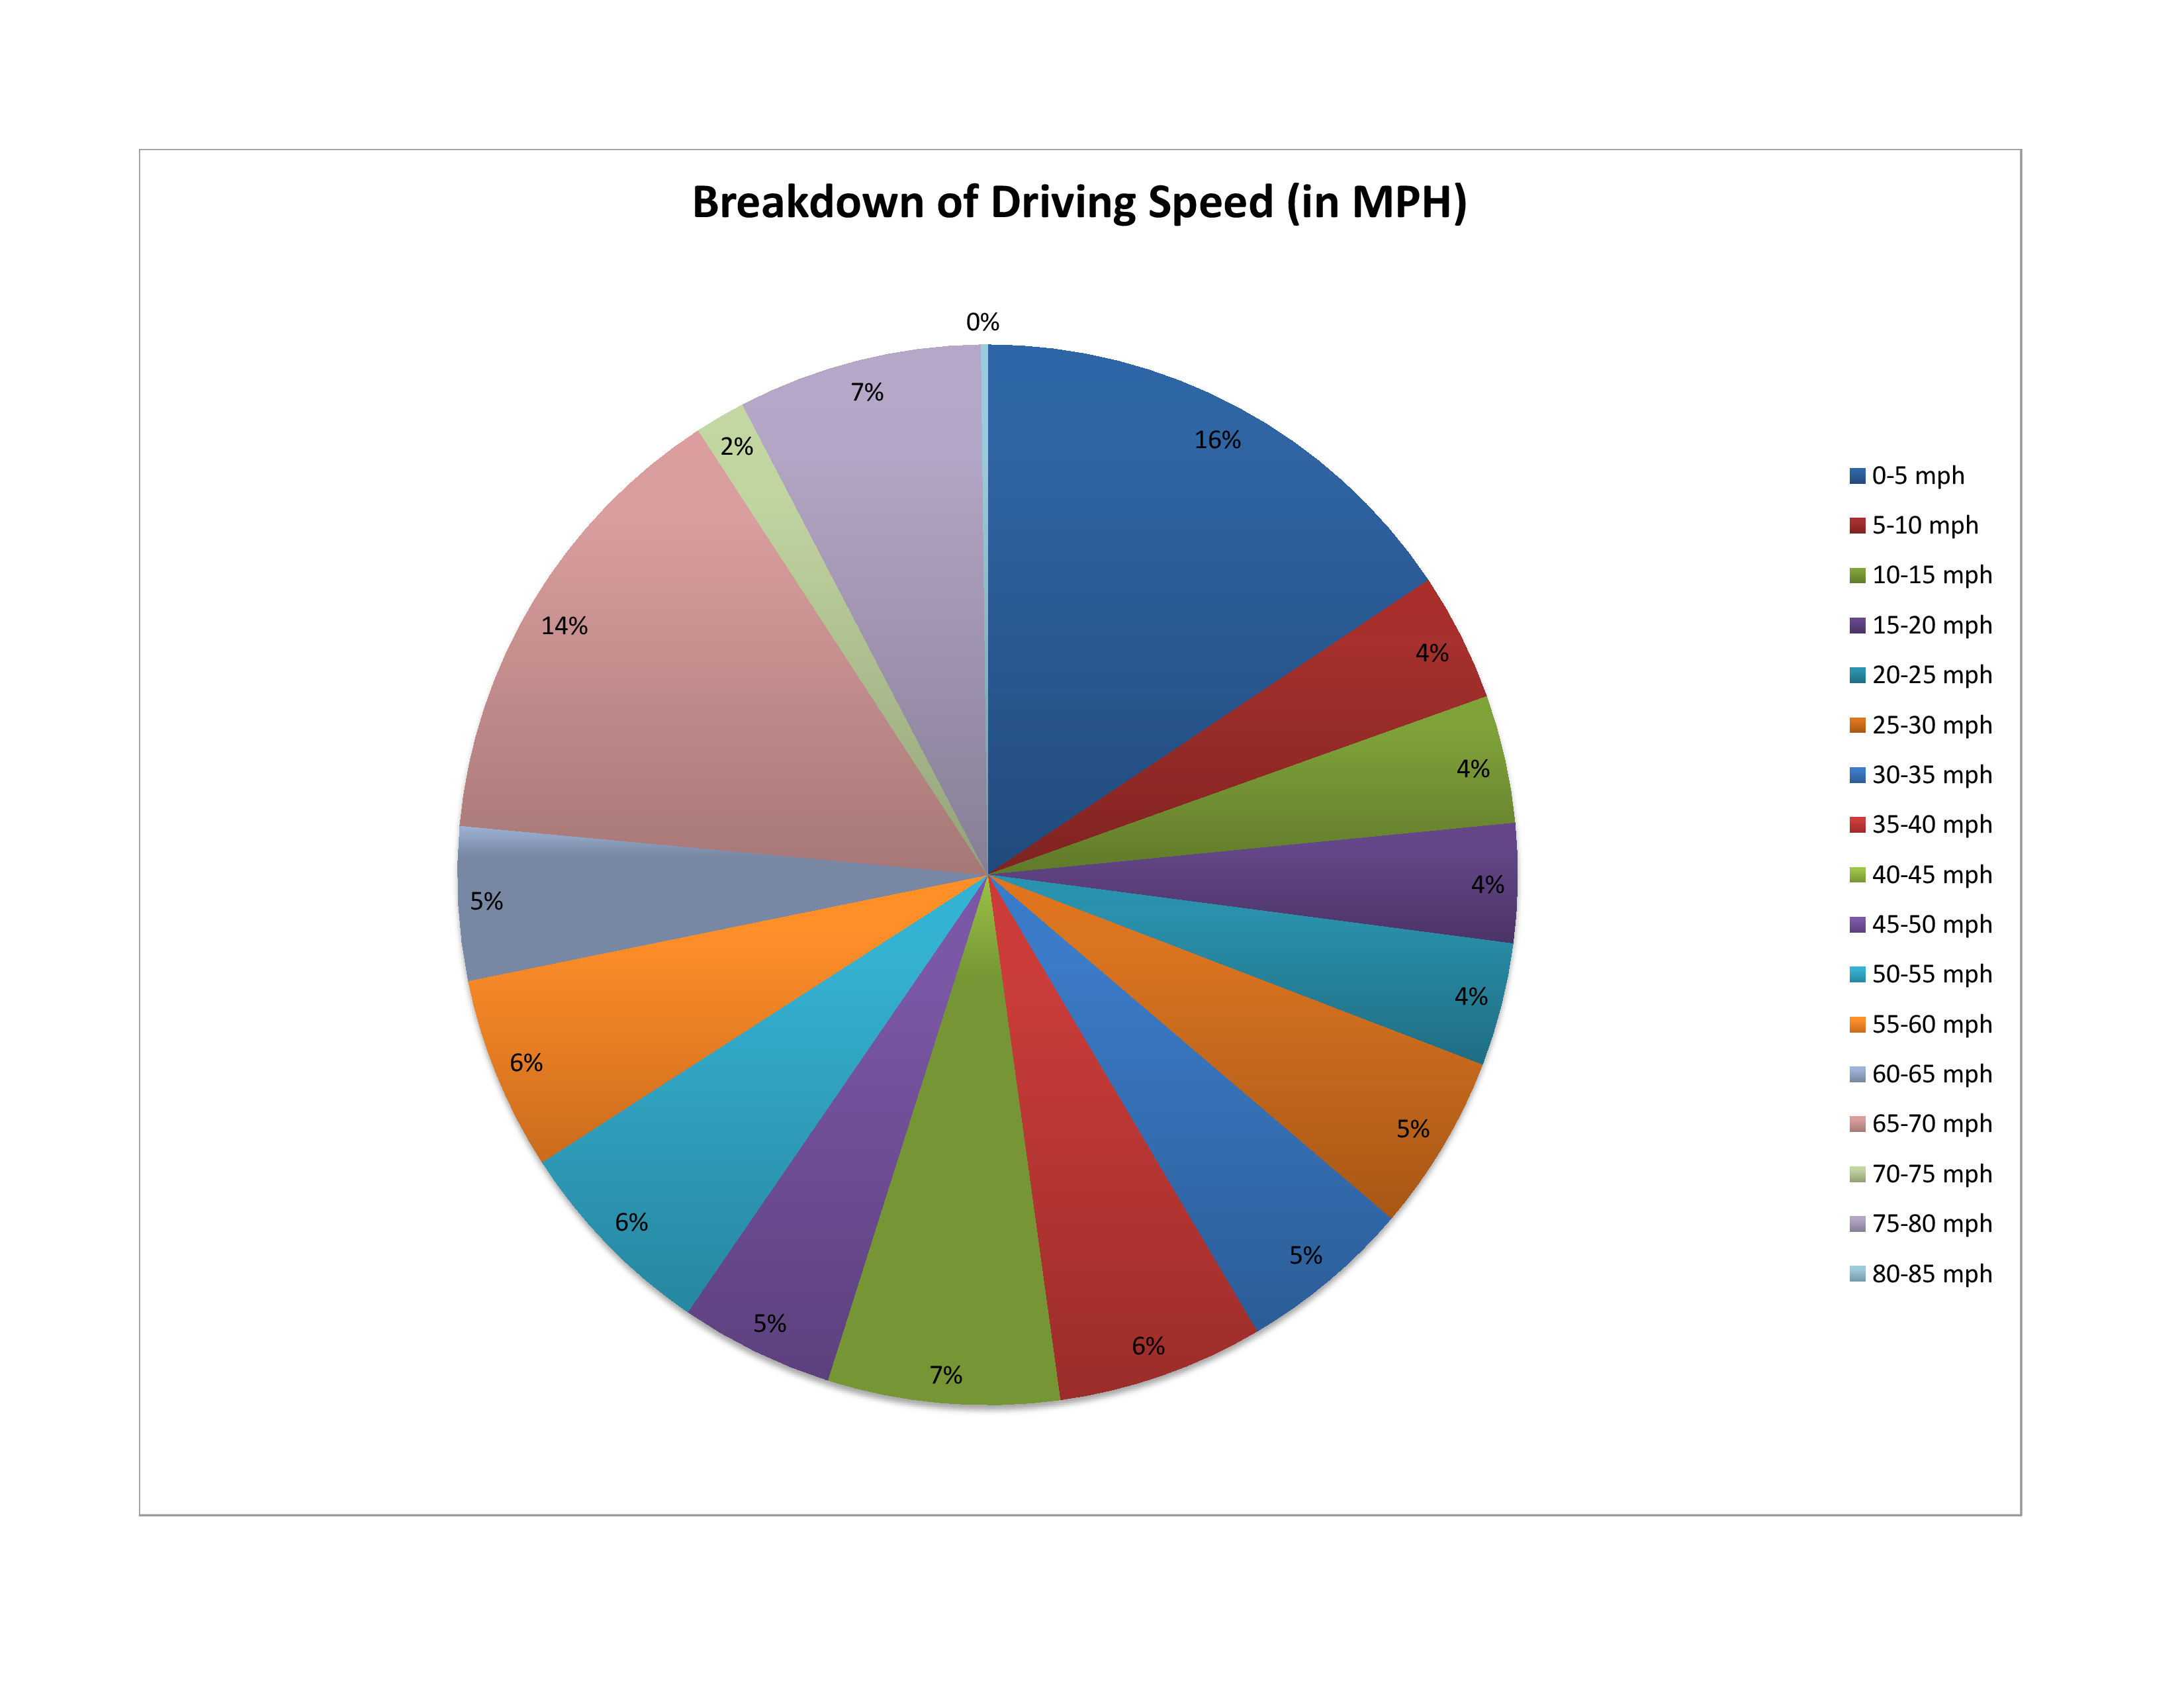
In terms of driving speeds, my average speed was 39.4 mph, ranging from 0 to 83.3 mph. The graph of distributions of my driving speeds looks like:
Overall, I am pretty happy that I was able to get these kinds of metrics from my car, and I look forward to mining them in the future for whatever I feel like doing.