In my last blog, I described how I broke down Ticket to Ride: Nordic Countries into a statistical model that I could use in the design of Ticket to Ride: Iceland. In this one, I’ll look at how I started to build up the board and what the main challenges were.
The first thing I needed was a base layer that approximately matched the proportions of the Nordic Countries board. I found a very nice physical map on wikimedia commons, which did the trick. The nice thing about this particular map was that it was not really high contrast, and would allow me to easily put place labels and other imagery that would stand out.
Before I even started placement of cities or tracks on the board, I did some research. I needed to know what the major cities of Iceland were, where they were located, what geologic features I should keep an eye out for, and what some of the major roads were. I should call out that Iceland does not have an extensive rail network – I knew this going in, but instead envisioned a future where the Icelandic people had developed a mass-transit system with zero-environmental impact, had the capability to withstand the geologic stresses of the region, and looked like classic trains.
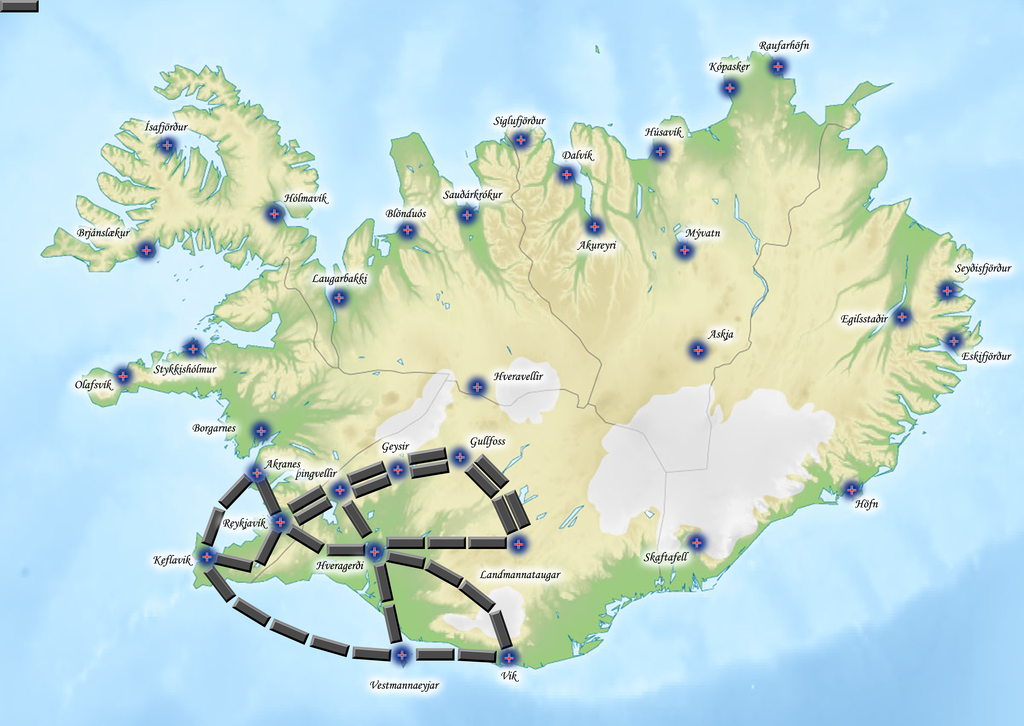
Once I had a general idea of what cities I wanted to use and where they were located, I designed a little city marker based on the Icelandic flag, and started placing the cities. I tried to get these markers as close as I could (with the maps that I had available) to their locations. A lot of times I used relative locations to fjords, rivers, lakes, and other physical features as a guide and hoped it would be close enough. I also created city labels which I put near the cities but didn’t worry too much about positioning (since they would need to be placed after the tracks anyway).
Once I got what I thought was a reasonable city distribution, I started building tracks. I spent quite a bit of time on my track graphic – giving it the raised feel, making sure it was the right size, etc. But, once I got it right, I started defining connections between pairs of cities and putting down tracks. Generally speaking, this process took the form:
- Choose a pair of cities that should have a connection.
- Guess how many tracks might be between them.
- Copy/Paste/Rename enough copies of the track template.
- Rotate each track segment to form a contiguous track that looks nice.
- Possibly nudge the source or destination city, add/remove a track segment, or shift around other tracks if needed.
As you can probably imagine, steps four and five were the most fiddly and took the longest. As a whole, laying track that looked decent was far and away the part of the process that took the most time (months).
 At this point, none of the tracks were colored, but I cataloged all the connections in my new Iceland spreadsheet so that I could track the track distributions. This helped me understand when I was creating tracks whether I should fix a half-track by adding a track and bowing the path out a bit, or removing a track and straightening it up. It also helped me decide (along with the topology) whether a pair of cities should have two parallel paths or just a single connection.
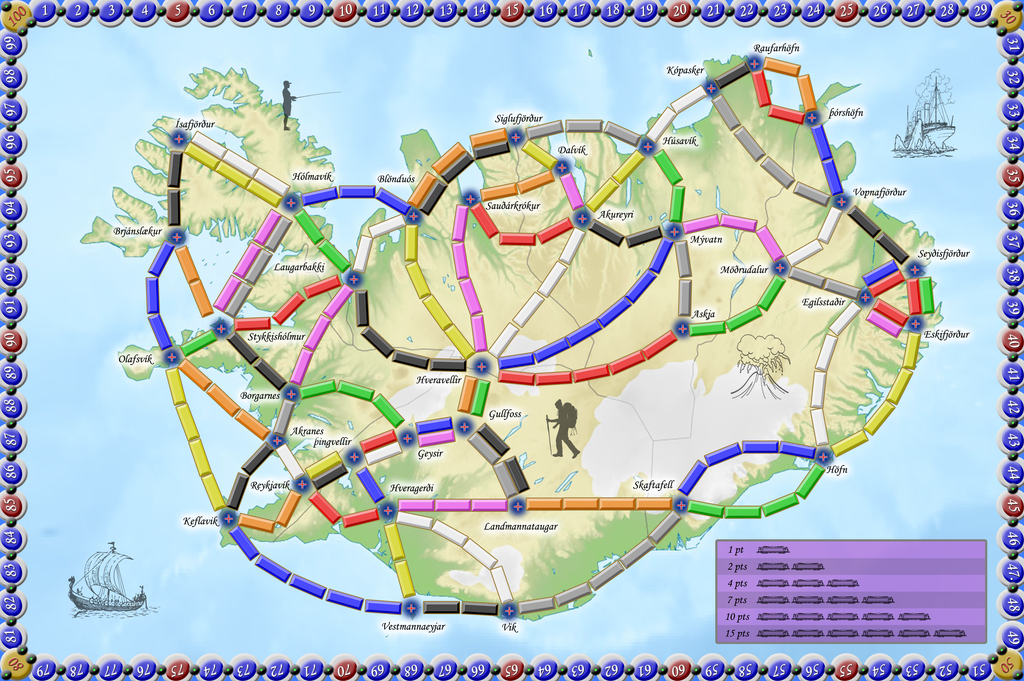
While I was working on the tracks, I took a number of detours (to prevent my brain from melting). I designed the score track, scoring guide, and various embellishments as I finished regions of track. Each of these pieces involved less details in general – E.g. once I got a few scoring bubbles down, it was easy copy/paste where the new position was completely determined mathematically.
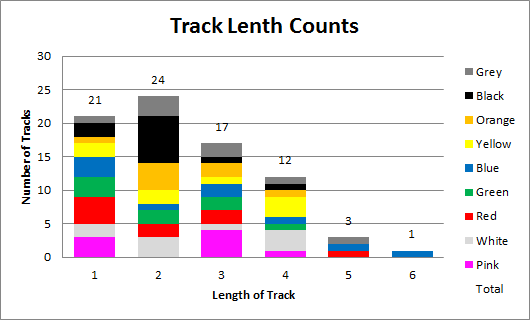
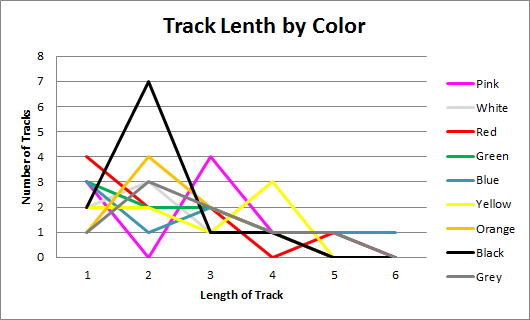
The last step on creating the board was adding color to all the tracks. This was relatively quick and painless, and actually didn’t take that much work. Using my stats spreadsheet as a guide, I was able to tune the distributions of number of tracks, average length, and percent shared of each color with relative ease. I also made the decision that I wouldn’t use ferries or tunnels as part of Ticket to Ride: Iceland. While I could certainly see that they added a bit of variety, I wanted to keep things simple for this first foray.
For those who like some graphs, here are the final distributions for the Ticket to Ride: Iceland board that I made:
 With that, the board was essentially done.
 Next, I moved on to building the ticket card deck.